

🎯 Executive Summary
The global Electric Vehicle (EV) industry is transitioning from regulatory subsidies to true market efficiency. Key insights:
- Deep Spatial Bifurcation: Saturated markets like Norway (97% share) are hitting physical limits, whereas Nepal has successfully modeled a tariff-led green leap (71% share) for developing countries.
- Shifting Growth Epicenter: Southeast Asia is leading the global CAGR charts, headed by Vietnam (1644%) and Indonesia (363%), indicating where the absolute growth margins reside.
- Localization Strategic Pivot: Automakers must adopt a split-geography model—capturing volume in Europe and expanding aggressively in Southeast Asia and Latin America through nearshore assembly and weak-grid tailored portfolios.
I. Current Overview: Four-Dimensional Spatial Gradient Analysis
In 2025, global Electric Vehicle (EV) adoption exhibits an unprecedented level of ‘spatial bifurcation’ and ‘gradient dispersion’. Based on the latest penetration rates, the global market has segmented into four distinct strategic tiers:
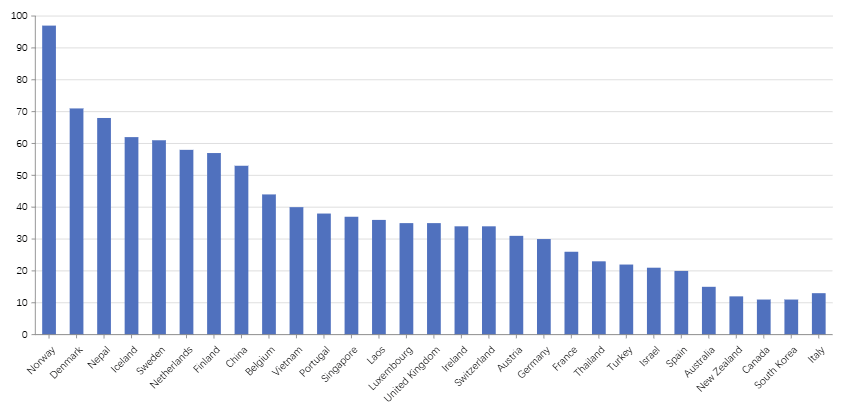
1. Tier 1: Highly Saturated Peak Zones (Penetration > 50%) — Nordic Saturation & the Nepal Model
Norway continues to lead globally with an astonishing 97% EV market share, having practically finalized its internal combustion engine (ICE) transition. Sweden (68%), Finland (61%), and Belgium (53%) define the highly saturated core European zone, driven by immense fiscal subsidies, premium charging network grids, and high disposable incomes. However, the true anomaly in this tier is Nepal, which has climbed to a 71% market share. By utilizing 100% clean hydroelectric power and heavily penalizing ICE imports, Nepal shatters the dogma that high income is a prerequisite for rapid EV adoption, offering an elegant blueprint for developing nations.
2. Tier 2: Moving into Mainstream (Penetration 20% – 50%) — The Normalized Transition of Major G20 Economies
Comprising major European economies and Asian market pioneers, including Portugal (40%), Laos (38%), UK (35%), Switzerland (34%), Germany (30%), Thailand (23%), and Israel (21%). These nations have successfully crossed the chasm from early adopters to early majority. Notably, Thailand leading Southeast Asia at 23% highlights its success in transforming its traditional automotive sector (‘Detroit of Asia’) towards electrification.
3. Tier 3: Emerging Potential Belts (Penetration 5% – 20%) — Infrastructure Challenges and Geographic Limits
Including Australia (15%), Italy (13%), Canada (11%), Poland (10%), and Brazil (9%). These nations suffer from massive geographic spans, lagging charging networks in rural/intercity routes (such as Canada and Australia), or highly established and protected local ICE manufacturing interests. Consequently, consumers remain highly cost-sensitive and range-anxious, making the adoption curve relatively flat.
4. Tier 4: Latent Super-Blue Oceans (Penetration < 5%) — Infrastructure & Power Grid Bottlenecks
As the world’s most populous regions, India (4%) and Russia (2%) maintain minimal market share due to critical lack of grid capacities, high import duties, and minimal entry-level EV portfolios. However, this also implies that once local manufacturing is unlocked and affordable models are introduced, this tier will yield massive volumes, representing the ultimate global blue oceans.
II. Mid-Term Growth CAGR (2021-2025): Decoding the Underlying Mechanics
Analyzing 2025 market shares alone conceals the true seismic shifts. An analysis of the 2021-2025 compound annual growth rates (CAGR) reveals the deep-seated drivers of emerging market growth:
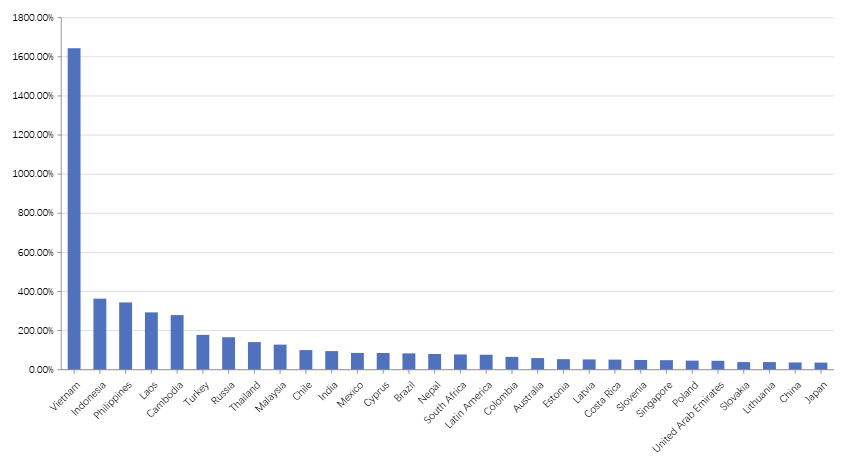
1. Southeast Asia’s Stormy Surge: Policy Alignments, Local Champions, and Chinese Supply Chains
Vietnam registered an astonishing 1644% CAGR, leading globally. This explosive growth was driven by local champion VinFast’s aggressive domestic manufacturing, charging grid expansion, and local ride-hailing networks (GSM). Concurrently, Indonesia (363% CAGR), the Philippines (344%), Laos (293%), and Cambodia (279%) dominated the top five growth positions globally. Chinese OEMs (BYD, Wuling, GWM) catalyzed this surge by exporting affordable, fully-featured EVs to these virgin markets, aligning perfectly with local governments’ electrification targets.
2. Natural Resources & Trade Shelters: Driving Local Supply to Trigger Domestic Demand
Indonesia serves as a global blueprint. By leveraging its vast nickel reserves, the Indonesian government banned raw ore exports and mandated minimum local content (TKDN) requirements, forcing global battery and EV makers to establish local supply chains, which in turn accelerated domestic market interest. Similar dynamics explain the rapid growth in Turkey (178%), Brazil (84%), and Mexico (86%). These geographic gateways utilize tariffs or free-trade zones (such as USMCA in Mexico) to demand local manufacturing, driving localized EV penetration.
|
Country / Region |
CAGR (2021-25) |
Core Business Model & Driver Strategy
|
|---|---|---|
|
Vietnam |
1644.0% |
VinFast’s national champion model coupled with captive ride-hailing integration (GSM). |
|
Indonesia |
363.0% |
Forced localization of lithium battery raw materials (nickel ore) matched with compact vehicles like Wuling Air EV. |
|
Turkey |
178.0% |
Launch of TogG national brand paired with protective anti-dumping tariffs on non-EU EVs. |
|
Mexico |
86.0% |
USMCA nearshoring boom, turning Mexico into a low-tariff export platform to North America. |
Note: Giant automotive hubs like China (37%) and Japan (36%) ranked at the lower-mid tier in CAGR. This is not a sign of contraction. China, as the world’s largest EV market, has already surpassed its hyper-growth phase; its 37% CAGR still represents the largest absolute volume increase globally. Japan’s moderate growth reflects a conscious strategic delay by major domestic OEMs (Toyota, Honda) preferring Hybrid (HEV) and fuel-cell (FCEV) routes over pure battery electric vehicles.
III. Future Global NEV Trends: The Rules of Survival in a Fragmenting World
As global EV adoption shifts from regulatory subsidies to organic demand, three defining structural trends will shape the next 3-5 years:
- Transition to True Price-Parity and Consolidation in Mature Markets: With markets like Norway and Sweden reaching physics-based penetration peaks, major European governments are phasing out fiscal EV buying subsidies. The competitive landscape will shift from capturing tax exemptions to a brutal cost-war of price-parity with ICEs, software-defined cockpit value, and absolute cost efficiency. OEMs unable to verticalize battery supply chains will face severe marginalization.
- Regionalization and Nearshoring of Supply Chains: Rising trade friction is fragmenting the global industrial chain. To bypass tariffs, the global EV supply chain is transitioning from ‘centralized Chinese exports’ to a highly regionalized model. Mexico, Turkey, Hungary, and Thailand will solidify their positions as regional automotive assembly epicenters. True localization and regulatory compliance are no longer optional, but the primary prerequisite for market access.
- High-Growth Emerging Belts Demanding Tailored, Low-Cost Portfolios: Virtually all future growth momentum will shift to South/Southeast Asia, South America, and parts of the Middle East. These emerging markets require unique adaptations—such as coping with weaker power grids, severe heat, and limited disposable income. Success here will be dominated by low-cost, robust, high-ground-clearance compact models that solve practical consumer constraints.
IV. Strategic Recommendations for OEMs and Institutional Investors
💡 Core Strategic Recommendations by beatdata.io:
- 👉 Recommendation 1: Adopt a Split-Geographical Allocation Strategy. Target mature European markets for brand positioning and value capture, but aggressively deploy capital into Vietnam, Indonesia, Brazil, and Mexico for rapid volume growth. Leverage CKD or JV partnerships to build early regional footprints.
- 👉 Recommendation 2: Redesign Product Portfolios to Survive Weak-Infrastructure Landscapes. Build reliable, compact, and energy-efficient vehicles. In infrastructure-constrained regions, pioneer flexible charging models, exchangeable battery programs, or robust hybrid options rather than relying purely on massive screen ADAS tech and DC fast charging dependency.
- 👉 Recommendation 3: Build Geopolitically Immune Supply Chains via Strategic Gateways. Focus investments on crucial industrial hubs—such as Indonesia’s battery ecosystems, Turkey’s regional assembly points, and Mexico’s localized components framework. By utilizing regional trade agreements, mitigate geopolitical risks.
Free Report Download
2025 Global Electric Vehicle Market Share Report
Access Raw Data
Global EV Sales and Market Share (Cars, 55+ Countries), 2010–2025